
Filter Plot
Customizing the Filter Plot
The filter plot tool is a lot like what you see on iClassPro’s web portal. Except now it’s on your website! So Coool! Okay okay, well…we think so. Here’s what you can do with it.
At the top of the Display Preferences for Filter Plot, there are some toggle switches. Who doesn’t love toggle switches? These will allow you to customize which filters to include in your Filter Plot tool. For example, if your school doesn’t use levels, or sessions. Just turn these filters off. For the filters that your school wants to include you can color code them.
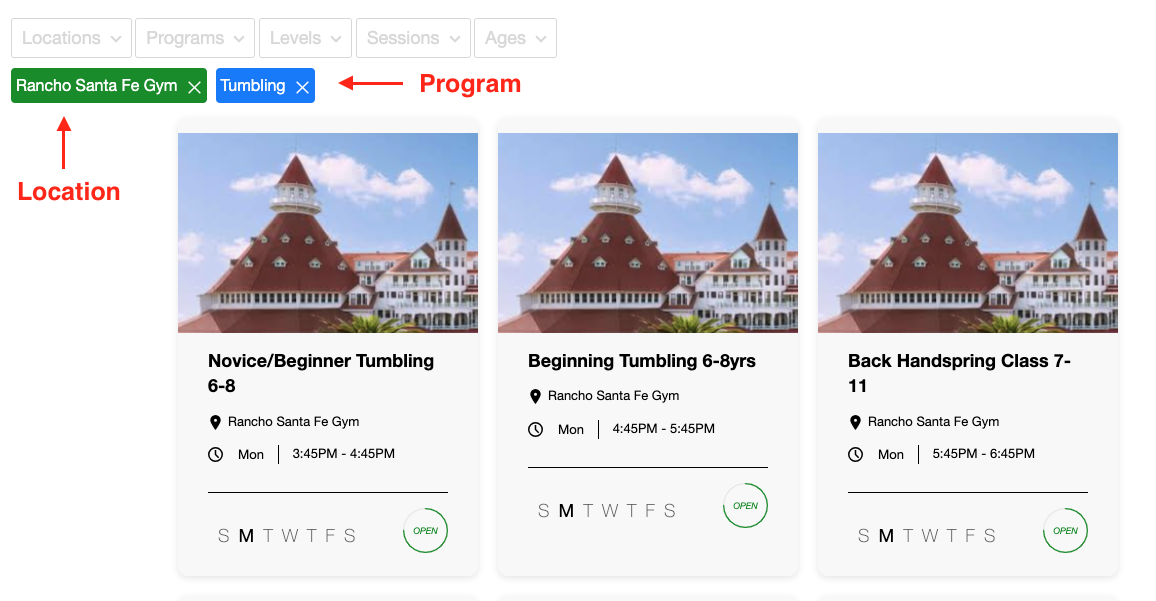
Why would I want to color code them? Each time a filter option is specified we will add it above the class options. This will effectively let users know that there is a filter engaged and the displayed classes are scoped to that filter. Conveniently, if they want to remove that filter, they don’t have to open the filter menu again and find their filter. They can just “X” close it out and the class options will automatically re render to include the new set of matching classes.
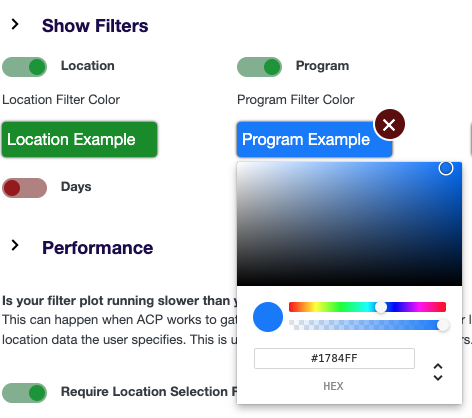
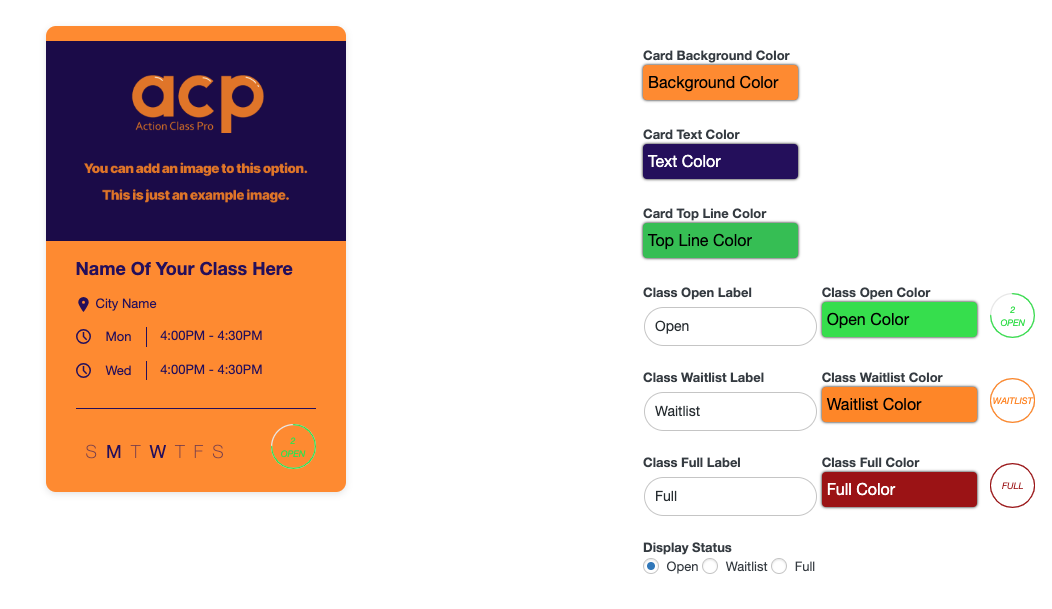
If you decide you would like the Filter Plot tool to resemble your schools branding, there are a series of options to select from which will allow it to appear with your own unique style.
Did you get all that? Because you’re looking pretty cool right now!

Related FAQs
The default styles are just default. Most schools prefer that they ACP tools match their brand. And with display preferences that is easy to do.
Make sure that you SAVE your filter plot display preferences. Then if they still don’t match your public facing website’s appearance you may have some theme styles effecting your filter plot. This can usually be resolved with some simple CSS which your web designer can provide. Or you can always open a support ticket.

Got somethin' to say?