
Adding the Filter Plot
Adding the Filter Plot to your website
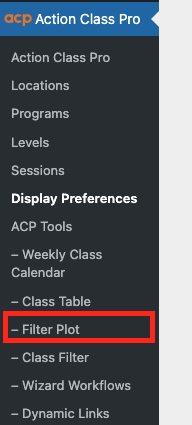
- First Navigate to Filter Plot in the Action Class Pro plugin navigation menu.
- When you are here you can go about continuing to customize your filter plot. After all you might use multiple filter plots. But wait, didn’t i just add preferences, why am i doing this again? The preferences just set your base expectations. You can customize everything further here.
- Change your filter colors again. Yes you just did this here. But hey, you’re in control. How’s that feel?
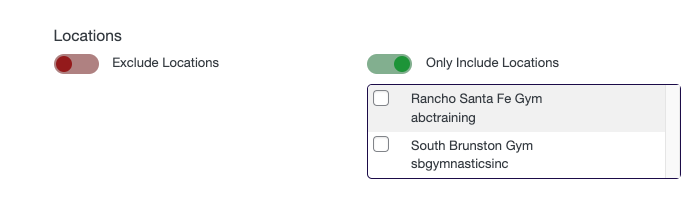
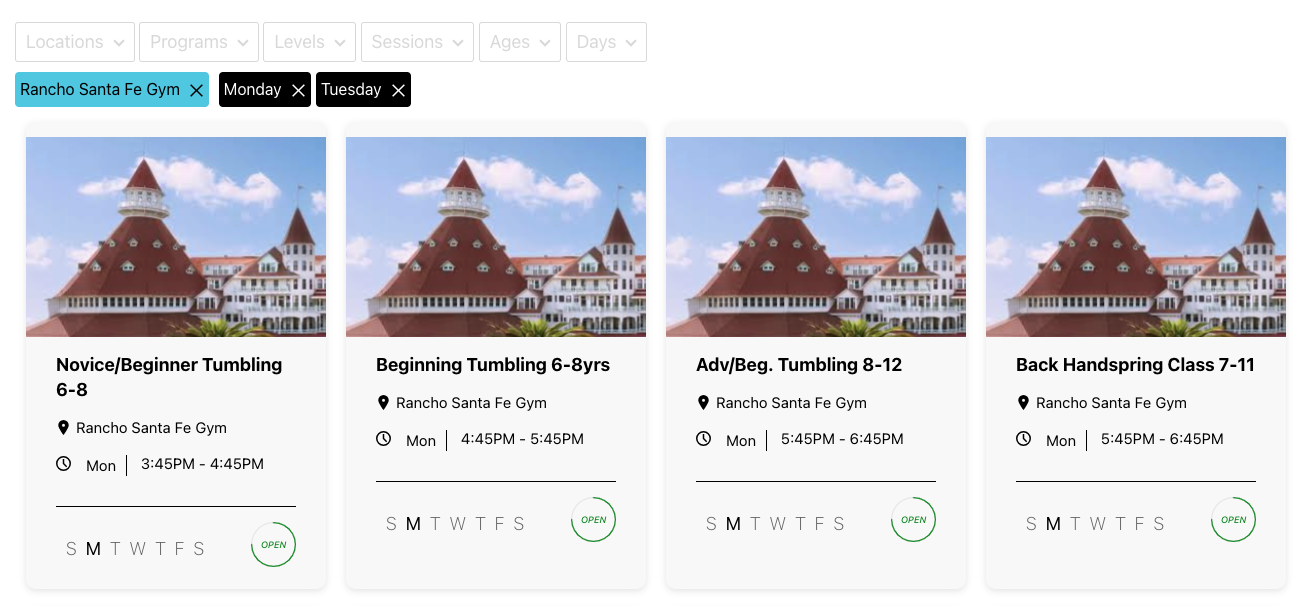
- Decide which filters you want to include in this filter plot by toggling filters on and off.
- Exclude or include various filter options. Let’s say you only want to show your locations in Southern California in this filter plot. That’s simple.
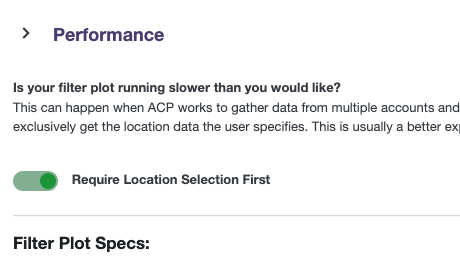
- Performance. Ok, here’s the deal with performance. iClassPro makes a request to it’s system to return classes for each location. These requests take around 5+ seconds to complete. So by turning on performance you tell your filterplot to ONLY get the classes for the location that the user specifies. If you turn this off, the filter plot tool will go and collect classes for all your locations. If you have 20 locations this will take a bunch of time. So Action Class Pro, again, gives you the power to decide.
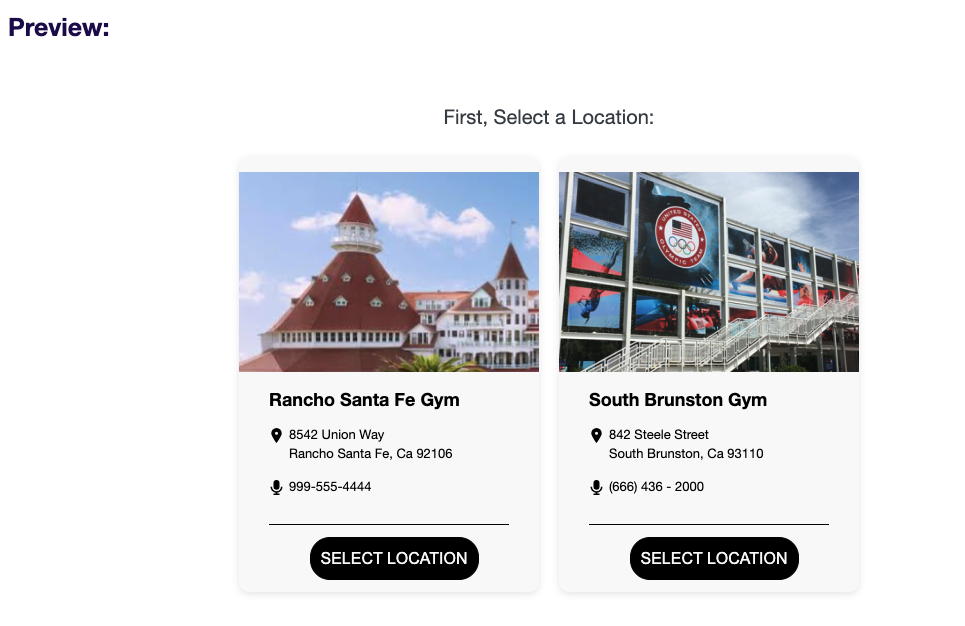
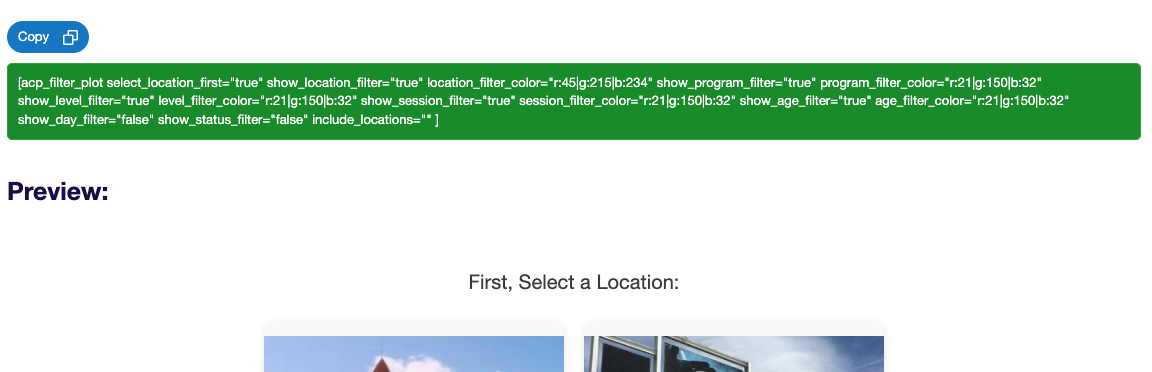
- Preview your Filter Plot. You are toggling all these options but how does it actually look? There is a preview at the bottom of the Filter Plot which gives you a real time representation of what to expect. So adjust it till your heart is content and happy.
- Copy the ShortCode. There is a green section right above the preview that builds our your shortcode in realtime. Click the copy button above the shortcode and paste it into your website wherever you like.
- Paste the Shortcode and Wham!! There it be, yarrrrrrg. (pirate voice)
Pat on the back, you’re really good at this.


Got somethin' to say?